Have you ever wondered why we build so many freeways? Why our roads are so wide and we’re always building more of them? Of course you haven’t, the answer is too obvious. Lots and lots of people drive here for everything. Going to work? Jump in the car! Going to the grocery store? Jump in the car! Going to the bar? Jump in the car! (hey, that rhymed!) Going to your neighbor’s house next door? Jump in the car! And we have lots and lots of money for building all these new roads, and have spent lots and lots of time planning for these new roads*. And people like to go fast because they hate being in a car. Seriously, think about that. If people loved driving so much, wouldn’t they want to spend as much time in the car as possible? As it is, people can’t wait to get out of the car, so they call for faster roads and fewer stops on those roads.
People often cite trips to work as a record of how much people are driving, and I think that’s because that’s the most frequent and publicly accessible data we have available. It’s very crucial information because the AM and PM peak hours test the capacity of any transportation system and the largest number of the people utilizing that peak capacity is commuters. But it doesn’t tell us anything about other trips. It’s commonly accepted that non-commute trips usually have more than one person in the car, while commute trips far too often have only one person per car, but the American Community Survey (ACS) only covers commute trips in its surveys. Another source of data is the National Household Transportation Survey (NHTS). This was most recently administered in 2001 and again in 2008, and Maricopa Association of Governments (MAG) has validated and weighted the data for the region. Both of these data files are statistically significant but also have margins for error. One such example is on the 2008 NHTS data, 92% of people commuted to work by car, whether alone or with others. The total for the 2011 ACS is 88%. We have to be aware of the margin for error in the original data that exists with anything utilizing a sample size, and recognize that as such there is a greater margin for error in my own calculations below specifically because I’m using multiple data sources.
I touched on this the other day in my LOS post, but our existing transportation system is nowhere near capacity. There are certain times of the day and certain locations that certainly meet or exceed engineered capacity, but the system as a whole is not near capacity. This is especially true during non-peak hours, which only proves to solidify the importance of commute data. So while shifting modes from car to transit, bike, or foot at all times is important, for this exercise it’s most important during peak demand hours since all the congestion mitigation money we spend is going toward increasing that capacity.
The MAG Regional Transportation Plan (RTP) takes a look at broad revenue and expenses on regional transportation programs over the next 20+ years. The draft RTP being released this year has a horizon year of 2035 and takes into account population, employment, and travel projections. One of the things I did not see as I reviewed the 350-page document is a description of what the mode split of the models assumes (I note that it’s 350-pages because I speed read the document and the data may well be in one of the appendices). I’m working under the assumption that the mode split used in the traffic generation models is not significantly different from the NHTS survey.
Over the next 22 years the RTP has funding sources from ADOT which provides a Highway User Revenue Fund (HURF) such as gas tax, license fees, and emissions testing fees, of almost $6 billion, Proposition 400 funds which are dedicated 56.2% to freeways, 10.5% to arterial streets, and 33.3% to public transportation, and federal funding from Congestion Mitigation and Air Quality (CMAQ) and the Surface Transportation Program (STP). All told there is up to $13.9 billion dedicated to freeway construction and maintenance (if we assume all ADOT money goes toward freeways, which it doesn’t, but I’m trying to keep things simple), $2.7 billion for arterial roadways, $200 million for bike/ped projects, $7.9 billion for transit, and $187 million for air quality enhancement projects for a total of $24.9 billion. That’s a lot of money!
What I’d like to do is re-allocate that money. Why, you might ask? Because this is a bike blog and I want to see more money spent on biking! Oh, a real reason? Besides the health benefits, high economic return on investment and improved safety of our transportation network? It increases the capacity of our road network to carry people. And for much cheaper than building a bunch of new freeways and widening arterial roadways or building new infrastructure in the desert.
In Portland, 1990 is a year the city chooses to point out as when it began investing significantly in bike infrastructure. At that time the commute mode share for bikes was slightly higher than Phoenix today (0.78%) at around 1% of commute trips, but still dreadfully low. Over the next 18 years the city invested roughly $60 million in bike infrastructure and an additional $7.2 million in a biking promotional campaign through 2012. The 2009 ACS shows the city-wide bicycle mode split at 4.8%. Digging deeper it shows that there are many census tracts within the “close-in” neighborhoods with more than an 8% mode split. The average of census tracts within what is generally considered by locals to be the close-in neighborhoods averages out to a commute split of 13.1% of people commuting by bike. These selected tracts hold approximately 20% of the city’s commuters and shows how targeted infrastructure improvements can increase the number of people utilizing a bicycle for their primary mode of transportation for commuting.
This has resulted in Downtown Portland avoiding traffic gridlock despite targeted economic and population growth. If you’re not familiar with Portland’s geography, the Willamette River bisects the city separating the close-in eastside neighborhoods from downtown. As a result there are five arterial bridges that carry people from the eastern part of the city and suburbs into the downtown core (and two freeway bridges). The Steel Bridge was built in 1912 and has a lower deck for heavy rail and bike/ped traffic, and carries light rail traffic and one general purpose lane in each direction on the upper deck. The Morrison and Burnside Bridges are similar to one another in location and type and are the busiest bridges in the city**, and the Broadway Bridge carries streetcar traffic with mixed vehicles and is anecdotally the most popular bike route into downtown. I’ll just cut and paste the PortlandOregon.gov press release linked in the previous paragraph for the money quote:
Between 1990 and 2008 the number of vehicles on these four bridges increased by 12%, which is consistent with both increased population and activity***. However, the entire increase was borne by the bicycle (which are defined as “vehicles” in Oregon). The number of motor vehicles crossing those bridges has stayed essentially constant since 1990. Thus, those bridges work as well for automobiles today as they did in 1990 despite the increased demand for mobility.
A similar bridge about three miles south of the Hawthorne Bridge (the south most downtown bridge) is being built to replace the existing Sellwood Bridge. The current cost estimate is $307.5 million and can be used as a low estimate for adding or replacing the downtown bridges due to the necessity of permitting large vessel maritime traffic via either height or mechanical opening that doesn’t exist at the Sellwood crossing. This is all only the tip of the proverbial iceberg. Portland is planning on spending $600 million over the next 20 years with a goal of increasing its bike commute mode split to 20%.
That’s great for Portland, but what does this mean for the Phoenix area? It is an example of how committing to quality infrastructure, just as Phoenix has done for the past 50 years, can guide the transportation choices people make. We’ve invested hundreds of billions of [inflated] dollars to construct one of the best road networks in the country so it’s no wonder people drive. But what would it look like if we shifted some of that money from freeways and high-speed arterials to bike infrastructure? Let’s take a look at what the future could hold. I’ve taken the 2035 data directly from MAG’s RTP and loaded it into excel. The two sections on the right are ones I added, including the per capita amount for each scenario (2011, 2035 RTP, and 2035 No Build). Further right still I added the 2035 ATP (Anthony Transportation Plan) which is an exceedingly simple mid-point between the full RTP build-out and the no-build scenario.
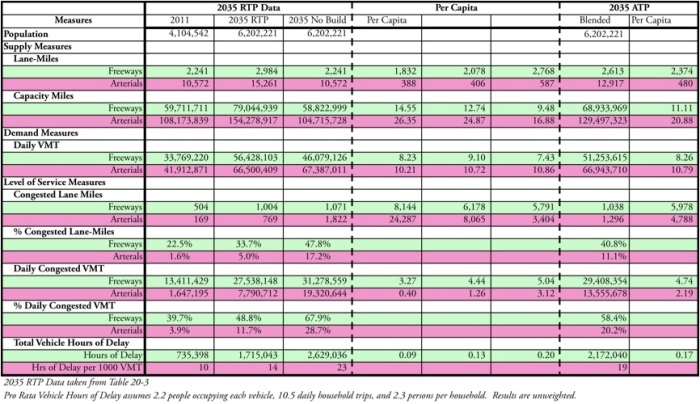
RTP Congestion Findings and Alternative Suggestion
One of the things we see between the build-out and no-build scenario is that the no-build projects fewer vehicle miles traveled but almost all of those miles are taken off freeways, presumably due to congestion. This results in higher congestion on arterial roadways. What I want to focus on, and the reason we’re spending up to $13 billion on new and “improved” freeways over the next 22 years, is the hours of delay. On a per trip basis the delay caused by congestion today is about 5 minutes. Spending all this extra money translates into 8 minutes of delay, which, why would we spend so much money just to get delayed even more? Well, because the models show 12 minutes of delay per trip taken in the no-build scenario. So what we’re really doing is saving everybody 4 minutes of drive time for each commute trip taken throughout the week.
What I’d like to propose… well, what I’d really like to propose is we de-fund all freeways except maintenance of some existing roadways, demolition of some existing freeways, and ITS measures including tolling… but what I’d like to propose for this exercise is a shift in the way we spend our money. As you’ve noticed, we’ve identified almost $25 billion in transportation expenditures over the next 22 years. Twenty-five billion, with a B. Yet, according to the RTP when discussing bicycles and pedestrians (chapter 12), “The cost to reconstruct existing roadways to accommodate the above plan is beyond the reasonable available revenues at this time.” The money is there. $25 billion is a big pie to share, but the reason there isn’t enough money to accommodate the bike/ped portion of the RTP is because it’s not a priority. The only commitment to the regional bike plan is whatever we can get from the federal governments and support that with a 5.7% match from our local municipalities.
There certainly are some restrictions in how we can use that $25 billion. Since the ADOT money comes from the HURF and the Arizona Revised Statutes (A.R.S. 28-6538) and Arizona State Constitution Section IX, article 14 prevents user fees from being used for non-highway uses. I haven’t the legal expertise to work around that to argue that expanded light rail or new commuter rail on freeway corridors would be considered as an appropriate expense because it effectively increases carrying capacity in the corridor. I think it may be because ADOT is running the show on the Passenger Rail Study between Tucson and Phoenix, but I’m not going to spend too much time arguing that HURF money could be used to add bike lanes on state roads like Country Club, or create bikeable shoulders on our rural 2-lane highways.
Prop 400 sets the allocated percentage of funds and distributes those funds between freeways, arterial streets, and transit. The language that I am familiar with on the arterial street element of Prop 400 is it says improvements and new arterial facilities a lot. I’ve been looking for the past several years for the actual legislative document for Prop 400 with no luck, so I stick with the annual reports like this for what knowledge I do have. What I’d like to do is shift some of the money spent specifically to create the opportunity for higher speeds and higher volume of car traffic on our arterial network to increasing the capacity and safety for people to bike.
For the remainder of the existing Prop 400 program I’d leave the freeway and transit aspects alone. I’d love to shift some of the funding for those, but politically it may be such a pain that we end up fighting about it until the extension expires at the end of 2024 rendering the entire purpose a wasted opportunity. Ultimately the money collected from Prop 400 and the inevitable Prop 500 are the highway funds I’d like to see used to improve cycling in and around our regional highways. Utilizing Prop 400 money to improve freeway crossings for people on bike, adding bicycle facilities to Country Club/Arizona Avenue, or widening the shoulder on Bush Highway or Rio Verde/Dynamite to improve safety for people driving and riding a bike would be especially helpful in connecting routes and improving access.
For the next 10 years I’d like to guarantee a portion of the arterial funding from Prop 400 to improving the bicycle facilities on arterial roadways. This would include adding protected bike lanes to 7th Street and 7th Avenue in Phoenix, building a cycle track on Thomas or Indian School all the way through Phoenix, placing (at a minimum) bike lanes on the entire length of Scottsdale and Rural Road, and countless other delayed or not-yet-planned projects to connect the region and enhance the cycling experience for many people. When Prop 400 expires and the inevitable Prop 500 goes to ballot, we need to ask for a shift in funding. Instead of wasting spending 56.2% of our funding on freeways, we shift the funds and dedicate a large amount to cycling and increase transit funding. Here is what the current allocation looks like with the assumption that Prop 500 is the same as Prop 400:
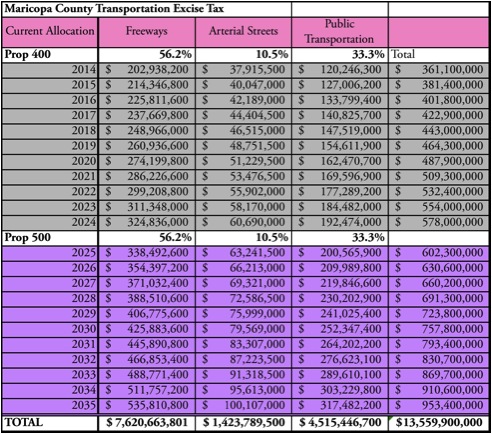
Proposition 400 Spending Allocation Through 2035
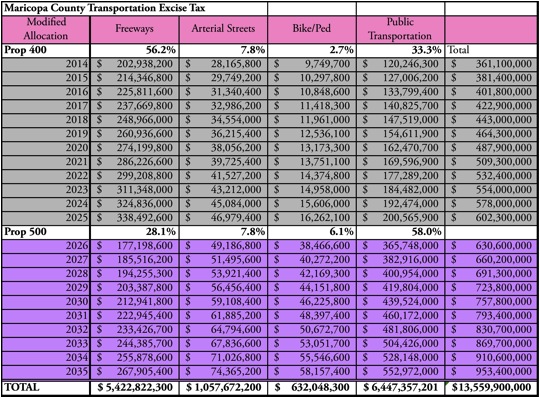
I have modified the allocations and added Bike/Ped to come up with the following table:

Modified Proposition 400 Spending Allocation Through 2035
When we add ADOT, STP, and CMAQ funding to the picture, the total funding for projects from 2014 – 2035 looks like this:

Total Original RTP and Revised RTP Funding Through 2035
When we compare these numbers to the “ATP” above you’ll notice that I cut new freeway miles and arterial miles in half but funding on freeways and arterial streets by about 15%. By shifting an additional $2 billion to transit and dedicating an extra $600 million in bike/ped we create an opportunity for greater infill development opportunity, thus reducing the need for new roadways. These road funds may be utilized to maintain our existing infrastructure as it begins to reach the end of its original life cycle, re-purpose and calm our arterial roadways, re-stripe arterials to better support mixed-mode transportation, and improve our ITS throughout the city. Eliminating the I-10 reliever and South Mountain Freeway would result in additional funding that could be used to provide grade-separated parallel bike facilities along freeways that turn a 10-mile commute from a slow, stoplight infested journey next to high-speed car traffic to a calm, peaceful, and quick bike commute that people of all skill levels could enjoy.
How much of a mode shift should we actually expect from all this re-allocation of money? Well, let’s take a look at Portland. They spent $60 million dollars over the 18 years beginning in 1990. To compare the cost and effectiveness across a geographic area I chose to take a look at their land area which is 133 square miles meaning they spent approximately $450,000 per square mile of land area in the city. The result of that spending was a 4.8% mode split city-wide. I measured the land area of what I typically consider to be “urbanized Phoenix” which is the area inside the loops, plus I added East Mesa, Apache Junction, Queen Creek, South Gilbert, South Chandler, and Ahwatukee, and ended up with 837 square miles of land. This means if we were to apply straight math with the same results per dollar spent over the entire region we’d have to spend $376,650,000 just to reach 4.5% mode share. But remember, there were some key census tracts that held 20% of the total city population and that mode split was 13.1%, so the money is being spent to strategically build new infrastructure where it is likely to make the biggest effect. So if we focus on the most heavily populated areas we come down to about 571 square miles and $257,950,000 needed. If the new distribution of funding is put into place immediately, and the results Portland has seen are matched, we can have 4.8% mode share by 2025.
My goal when I started this exercise is a 15% bike split by 2035. A lot would have to go right to make that happen; namely land use code would have to be changed and density would have to increase. Improving high capacity transit and making close-in neighborhoods where people want to live and where some density is promoted will do a lot to push toward achieving that goal, and that’s part of the purpose behind shifting $2 billion in freeway money to new transit investment. I would like to focus on building a streetcar network in Phoenix that ties to the light rail line for regional travel while strategically increasing densities along Camelback, 7th Avenue, 24th Street, 44th Street, Baseline, Grand Avenue, and McDowell, all contributing to an urban, vibrant, and diverse downtown core. While 15% mode share is a lofty goal, between the additional $2 billion in transit, the predicted increase in freeway congestion (again, regardless of whether we build hundreds of new lane miles or not), and the $830,000,000 in bike/ped infrastructure, it is an attainable goal. So what does that look like?
Working off the above scenario I’ve projected 45% single-occupancy vehicle (SOV) use, 12.5% carpool use, 15% public transportation use, 5% walking, 17.5% taxicab, bicycle, or other means, and 5.5% working from home in 2035. There are only six major cities in the country with an SOV rate below 50% for commuting, so I’m aware that this is ambitious… but it’s possible. And this is an exercise in potential, so I’m sticking with it. What does that future look like?
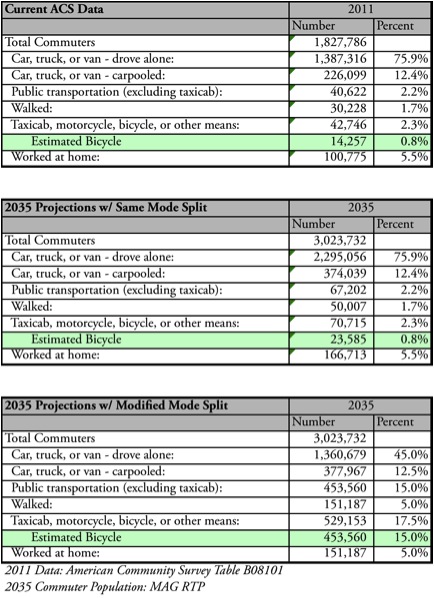
Actual, Projected, and Revised Projected Commute Mode Splits
If we are able to successfully invest in other modes and make them more attractive to people and get them out of driving alone we end up with fewer SOV’s [read: cars] on the road. If we assume a current carpool rate of 2.2 people per car and assume a future carpool rate of 2.7 people per car (to account for an increase in parking costs in the urban core, increase in fuel cost, and ITS measures to promote higher occupancy), the net gain of people using cars to commute daily will increase by 10,578 by 2035. By strategically placing the 372 new lane miles I suggested earlier, we can pinpoint bottlenecks and improve traffic flow where congestion occurs instead of just laying down expensive mile after expensive mile of exurban freeway.
At the end of this exercise, we’re spending the same amount of money on the transportation system whether we implement the RTP or the ATP. We still get a few new lane miles of freeway, add some new arterials in the exurban areas to allow for new development in the already platted subdivisions, but we could continue to allow everybody to have the freedom to drive their own car if we implement the full RTP, right? I’d be remiss if we didn’t take the opportunity to look at the economic benefits of freeing people from needing to own their own car. In fact, if we take the 2011 ACS data table B08141 which identifies the number of cars in a household by mode taken to commute and project that data into our 2035 assumptions we can see that implementing the ATP could reduce personal vehicle ownership by 665,837.
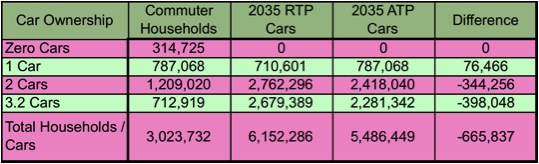
2035 RTP Car Ownership and Modified RTP Car Ownership Projections
AAA estimates the annual cost of owning a standard-sized sedan is $9,122 in 2013. Sources vary, but two numbers I found indicate that between 16% and 23% of funds spent on personal automobiles stays in the local economy. For this exercise I’ll use 23%. If we take these numbers and inflate auto ownership expenses at 3% per year, we see that households in the MAG region spend $11.6 billion less on car expenses with the ATP scenario than the RTP scenario. With $9 billion of that money being spent on cars leaving the local economy, by reducing our automobile dependence we keep those dollars flowing to local businesses (while simultaneously improving personal finances due to lower debt and greater opportunity for savings). At an average sales tax rate of 8.5% that means $762 hundred million of that spending is returned to cities and the state in the form of sales tax revenues every year. While not all of that tax revenue is a direct return from enhanced cycling infrastructure (as much of it is a return from transit investment), the sales tax revenue gained from this scenario is enough on its own to pay for all the cycling infrastructure improvements and then some.
Going beyond the sheer economics of being able to get rid of a car we get options. Look at the first table again. We can spend all this money on all these roads to try to speed up traffic, to get people places faster, but we still end up with more congestion than we have today. We literally cannot keep up with demand. By neglecting non-automobile modes of transit, we’re forcing our citizens to sit in traffic jams for an extra 8-12 minutes per trip. We’re promoting longer commutes and generally deteriorating the quality of life as 45-minute commutes turn to 60-minute commutes or longer. While the ATP doesn’t eliminate this congestion, it gives people options and maintains investment in the road network necessary to move goods. New light rail and streetcars promote strategic density and give more people an option to live in desirable neighborhoods closer to employment centers. Street calming and bike facilities make neighborhoods more habitable for families, slow traffic speeds, and generally make our existing urban centers more enjoyable to live and travel in. In either scenario people are free to sit in freeway traffic to and from work if they so choose. Only in a scenario where we shift the priority from moving cars to moving people can we honestly say we have transportation options. Why should we spend so much time and money building things that only make people unhappy when we could be improving people’s daily lives on a massive scale? It’s time for something drastically different, and it starts with changing our priorities and how we spend our money.
*Proposition 300 passed in 1984 and its extension Prop 400 passed in 2004 and dedicated a 1/2 cent sales tax to building the freeway loop system, major arterials, and eventually Metro Light Rail (among other things). South Mountain Freeway has been in the planning stages for over 30 years(!) as it was approved in both Prop 300 and Prop 400 and land use has been predicated on that freeway being built, making it very important in the models to “reduce congestion” which is why there are so many people committed to forcing that $1.9 BILLION project on us.
** Non-freeway division. They’re busier than the I-405 bridge, and since nobody really considers I-5 as being a bridge because the entire length of the freeway is a viaduct, they’re often considered the busiest bridges in the city by traffic volume
***Mr. Geller, the author of that paper, was referring to the four bridges with bike facilities. At the time those were Broadway, Steel, Burnside, and Hawthorne. In 2009 a protected bike lane was added on the Morrison Bridge giving all five bridges on the street network bicycle facilities.
Disclaimer: I interned at MAG in 2009-2010 in the transportation modeling division and have used all publically available data and sourced any data I received from MAG to their public site as well as data from the 2011 5-year ACS from the US Census. I have contributed work on some of this data previously, and am a contributing author on the Analysis of Add-on 2008 National Household Travel Survey. I have no current affiliation with MAG as an entity and all analysis and opinions contained in this post are my own. This is not an academic paper, and is not designed to withstand academic rigor; it is an exercise in potential and possibility. I have pulled a lot of data from a lot of sources, but some of the sources are disjointed and I am missing some data and have had to make some assumptions. For example, the NHTS data I used was from 2008 and the ACS data I used was from 2011; there was much that changed between those years, but it’s the best I have readily available. This was put together with about 20 hours of work over three weeks (and this is what I love to do and why I don’t blog very often, because this is the kind of content I like to put out). The actual Regional Transportation Plan is put together by MAG with thousands of worker hours over years of maintaining and creating new data sources. Many of the people working on it have multiple PhD’s and are using vast and complex models to project into the future. The work I put into this is in no way meant to discredit the work those people have done, it is merely a suggestive glimpse into something different. They are much smarter than I am, and I have learned a lot from people who have put the official RTP together. I would love nothing more than to perform a comprehensive analysis to determine the feasibility of this plan, but I certainly can’t do it from a volunteer position by myself before the data becomes completely obsolete.